Using Data Views
DocMgt offers a unique way to help users visualize their data using charts and graphs. Reporting users can create visualization templates called Data Views and give other users rights to those Data Views. When a user has performed a search they can choose to visualize that search by choosing from one of the pre-defined Data Views.
If there are any Data Views associated with the Record Type in which you just searched, you will see a new button appear with the picture of a graph. Click that button to see the Data Views available. Select the one you want by clicking its entry.
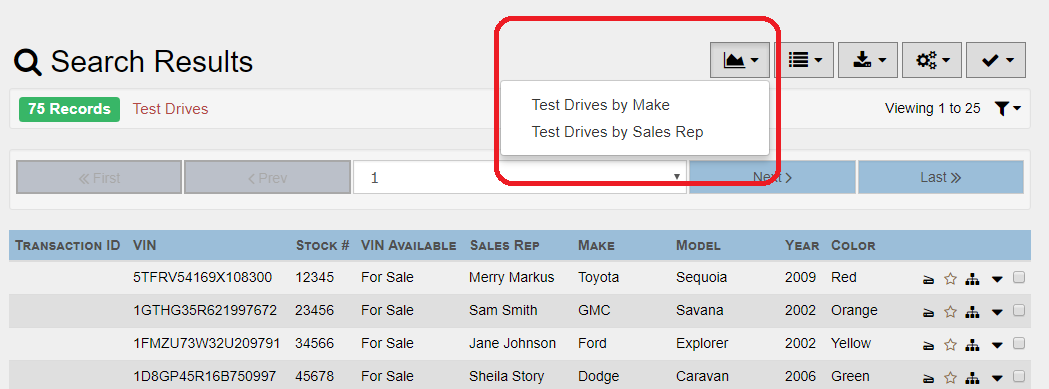
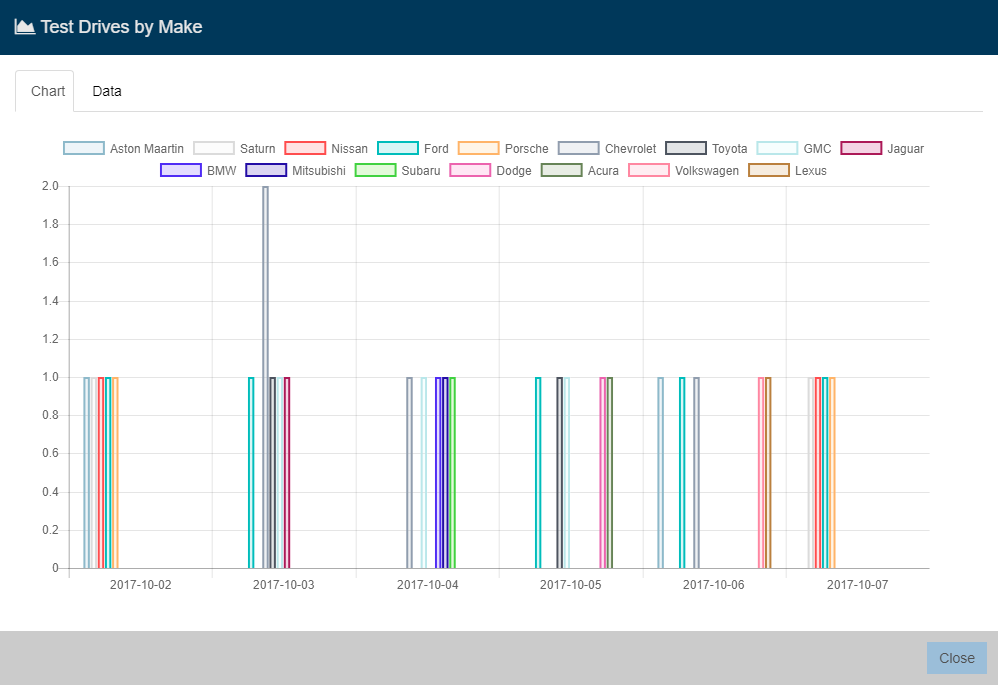
When you have selected a Data View you will see the graph appear. This is the data that you just searched but displayed in a graphical format.
Bar Chart Example
Line Chart Example
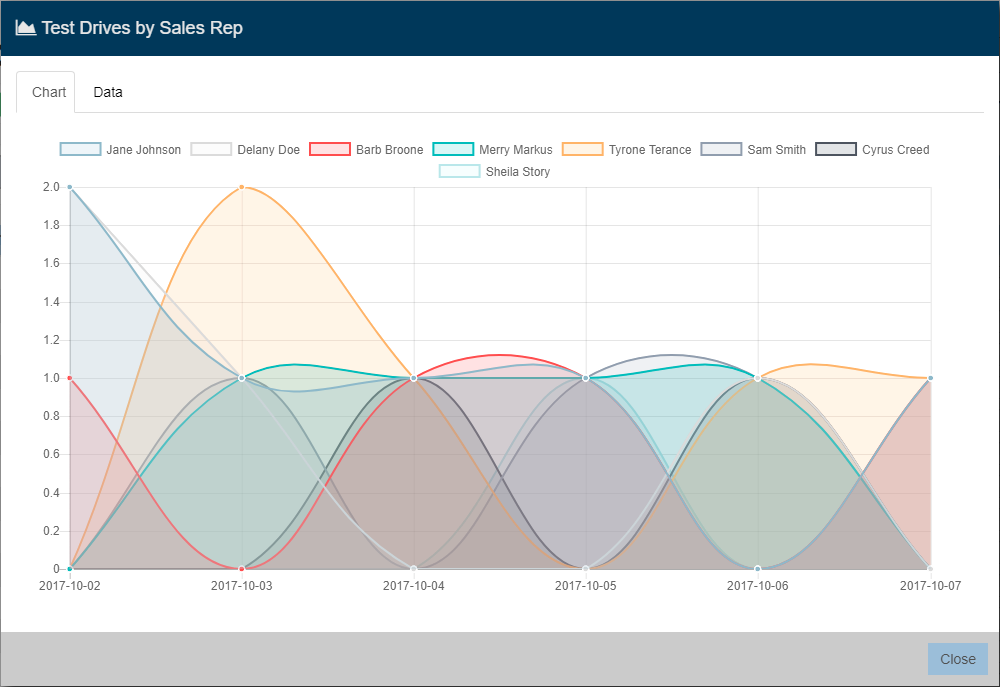
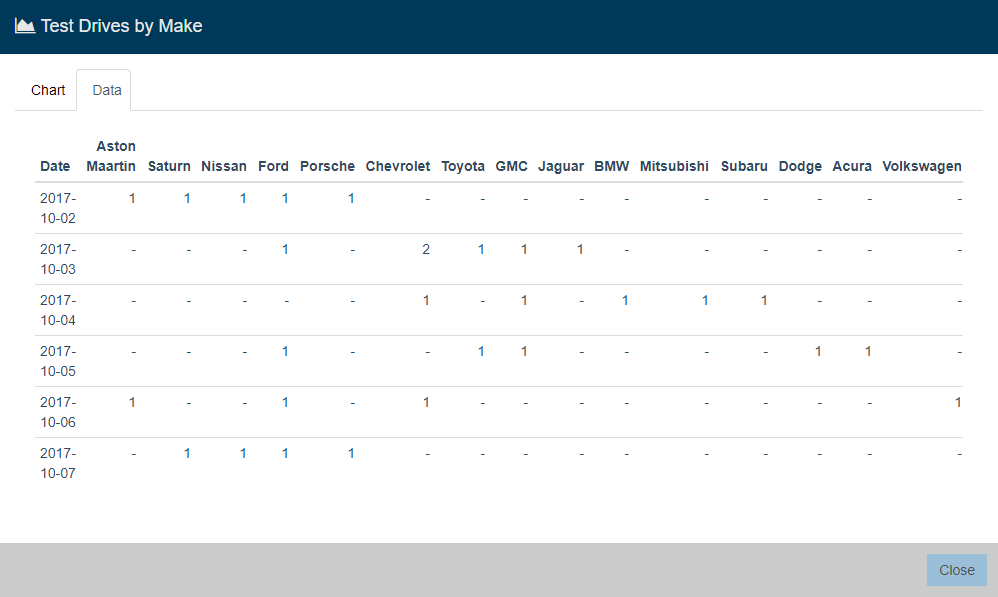
The data in the graphs is also represented in a table for easy review. Click the "Data" tab to see the data.
Consult a user with Reporting rights to have a Data View created for your use.